Is there a statistic from your database you would like to see quickly? Dashboards is where you can make that happen. You may have as many dashboards as you wish and within each dashboard you may have as many dashboard items as you wish.
In this article, http://trailblz.com/kb/?action=view&kb=320&cat=1, we show you how you can add lists and graphs to your dashboard. In addition, if there is a dashboard you would like to see that is not available, let us know at support@trailblz.com.
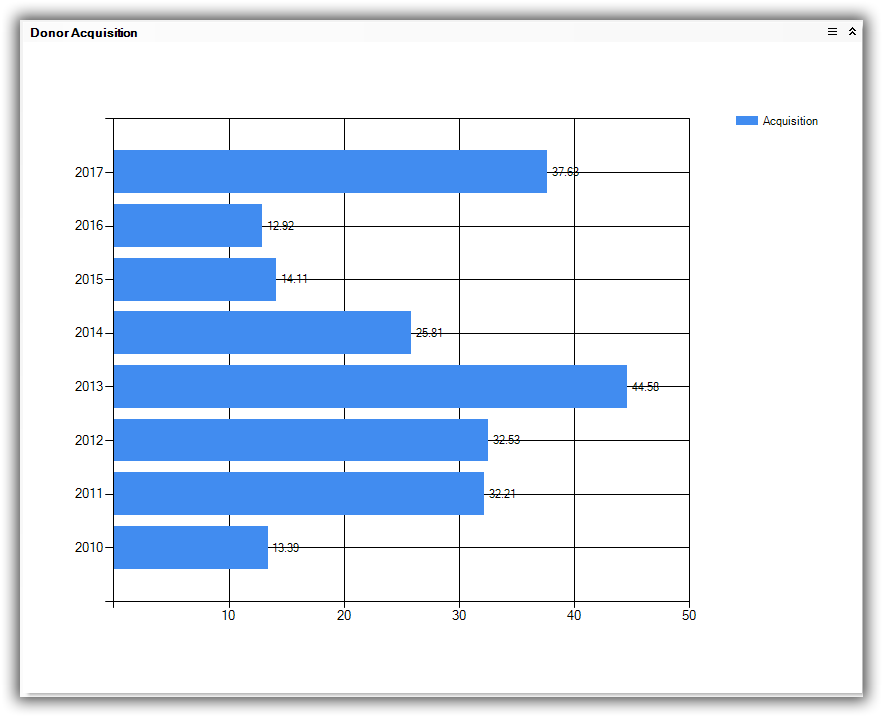
Below is a dashboard that shows your donor acquisition rates from year to year.
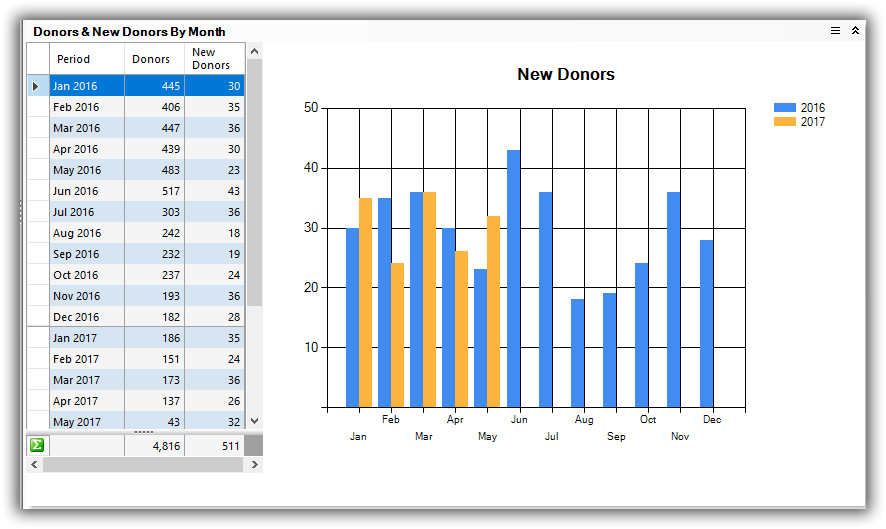
This table and chart combo shows your new donors by month by year:
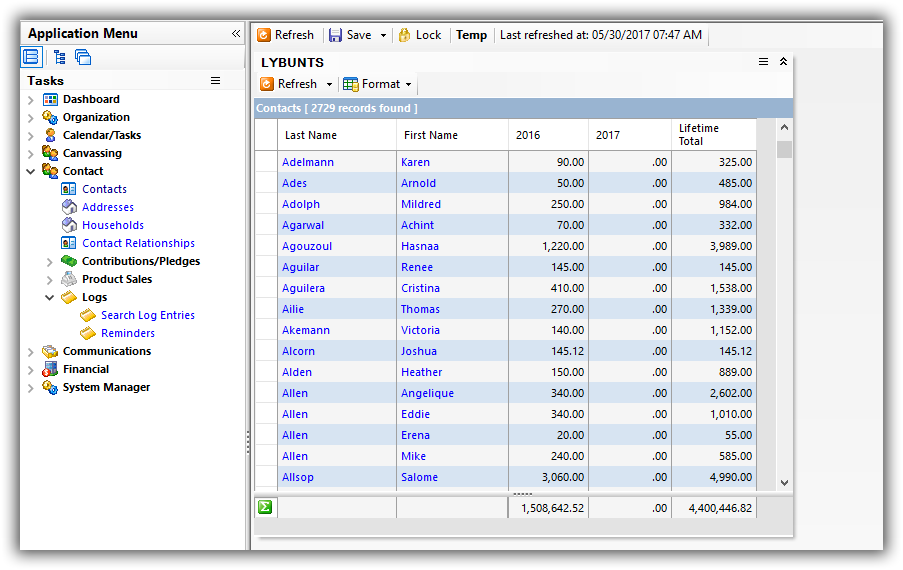
This is a list of your LYBUNTS without the need to run a query and load a format:
For all those customers who forwarded us their FEC Version 8.2 notifications, the version we deployed today has the new version installed.
Volunteers and Relationships
You can track volunteer hours through the relationship tab.